


During the discovery phase of a data heavy web based application, I noticed an issue that none of the respondents seem to point out. They were working with tabular data with the tables having up to 30 columns. Which meant that if you had a 15 inch laptop or a desktop monitor, you had to scroll to up to 4 screen lengths to the right to see the last column.

None of them wanted to think of this as a problem. These were all engineer-level users from 20s to late 50s. I believe, to think of ‘scrolling’ as an inconvenience would be too minor a thing to call a problem. But I did see them do the “mindless mouse-wheel scrolling” when they were showing me the application. This meant scrolling very fast and repeating ‘Oh where is it!’ in order to reach the correct column.
So, I pointed out and asked if it an annoyance to scroll to the correct column and almost all (who were concerned with that data) agreed. They said they had to do it a bit slowly but almost no one did!
Another thing was the moment you scroll to the right, the first column that shows the row headers moves out of the view. You need to do a bit of back and forth to know you are looking at the right row or cell.
I wanted to solve this. One option was to transpose the data, meaning turning columns into rows. This way the users can scroll vertically (more naturally) than horizontally. The problem, however, is that these table have been in that structure since they have been using tables to show the kind of data they contained. Basically, they are used to consuming that information that way. So the data has to be laid out horizontally. The client was OK with making the table that long because at some point it will be printed on a large paper sheet (A1 sizes) and stuck on the wall or be a part of a printed report.
The solution –
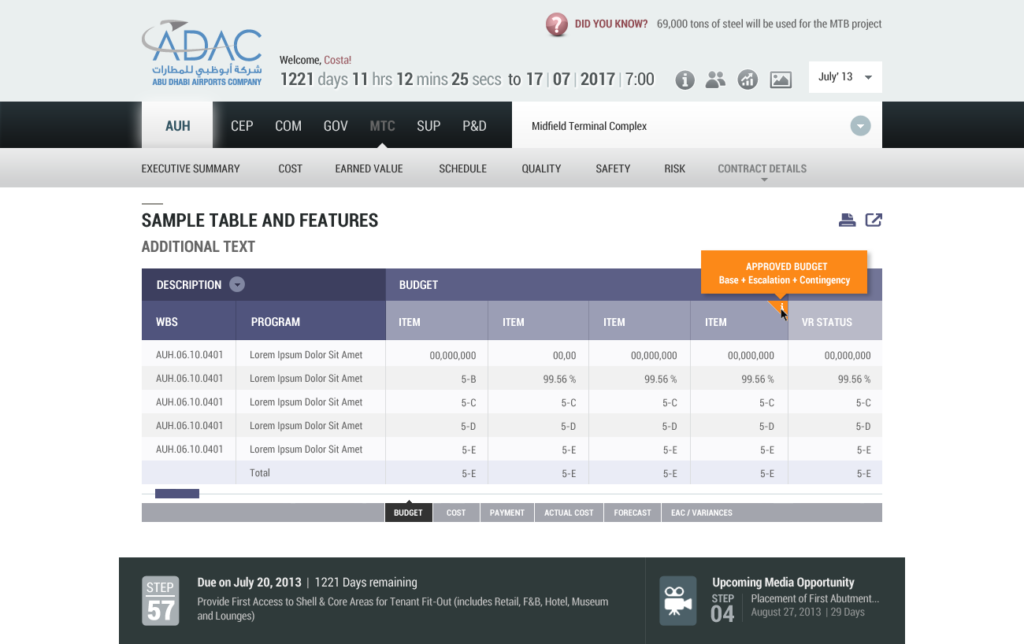
We had to make sure the viewing the table on a desktop monitor as well as a tablet should be easy. One part came from what they use commonly – MS Excel. We froze the first 2 columns. Now when the user scrolls to the right the row headers remain fixed.

These columns were grouped by their kind of data they contained. Each group had 5-7 columns and had a group header.

So, just under the scroll we added a shortcut link to jump to that particular column group. So if you clicked on ‘Forecast’, the table would scroll to the right till Forecast group of columns. This helped a lot since, not all the data in the table was viewed by everyone all the time. Users from different department wanted to look at different column group at different times. The shortcuts made the groups just one click away.
User could also collapse the column groups by clicking on the minus sign located in the top right of every group. This way users could print only the columns that were relevant to them.
Besides these changes, we added a drop down to show a Print and Export options.
The final version enjoyed the same visual familiarity of the existing table but hidden features made using them much easier and the data was much easier to consume.